Typically, the lowest sea ice extent is reached in the Arctic in mid-September, while the highest is reached in the Antarctic. This time is therefore particularly suitable for taking stock of the past northern summer or southern winter.
Minimum Antarctic sea ice cover
On February 18, the sea ice cover in the Antarctic reached its summer minimum of 1.97 million km², the third lowest value since satellite observations began (practically tied with second place, 2022) after 2023 and 2022. Once again, the large deviation from the long-term average – is striking, and this is now the third year in a row!
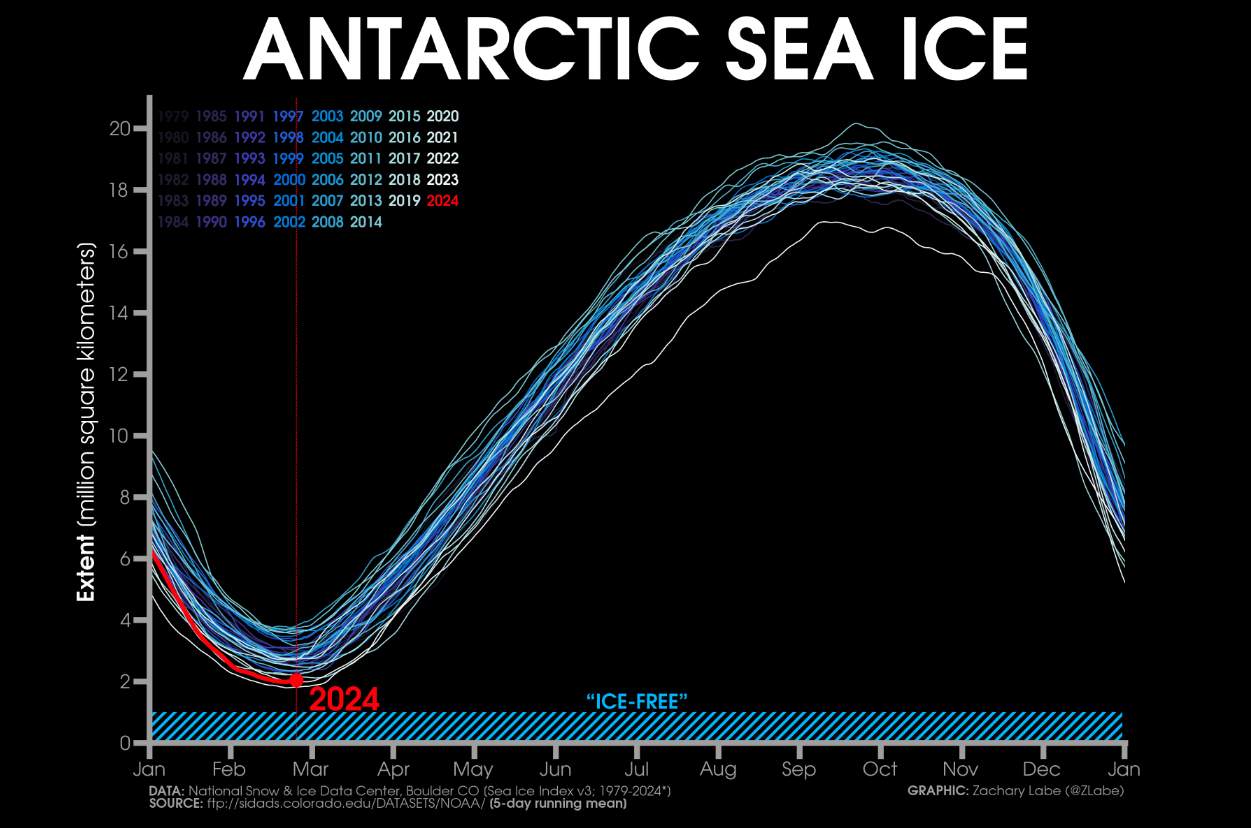
Fig. 1: Sea ice extent in the Antarctic compared with the years since 1979; Source: Zack Labe
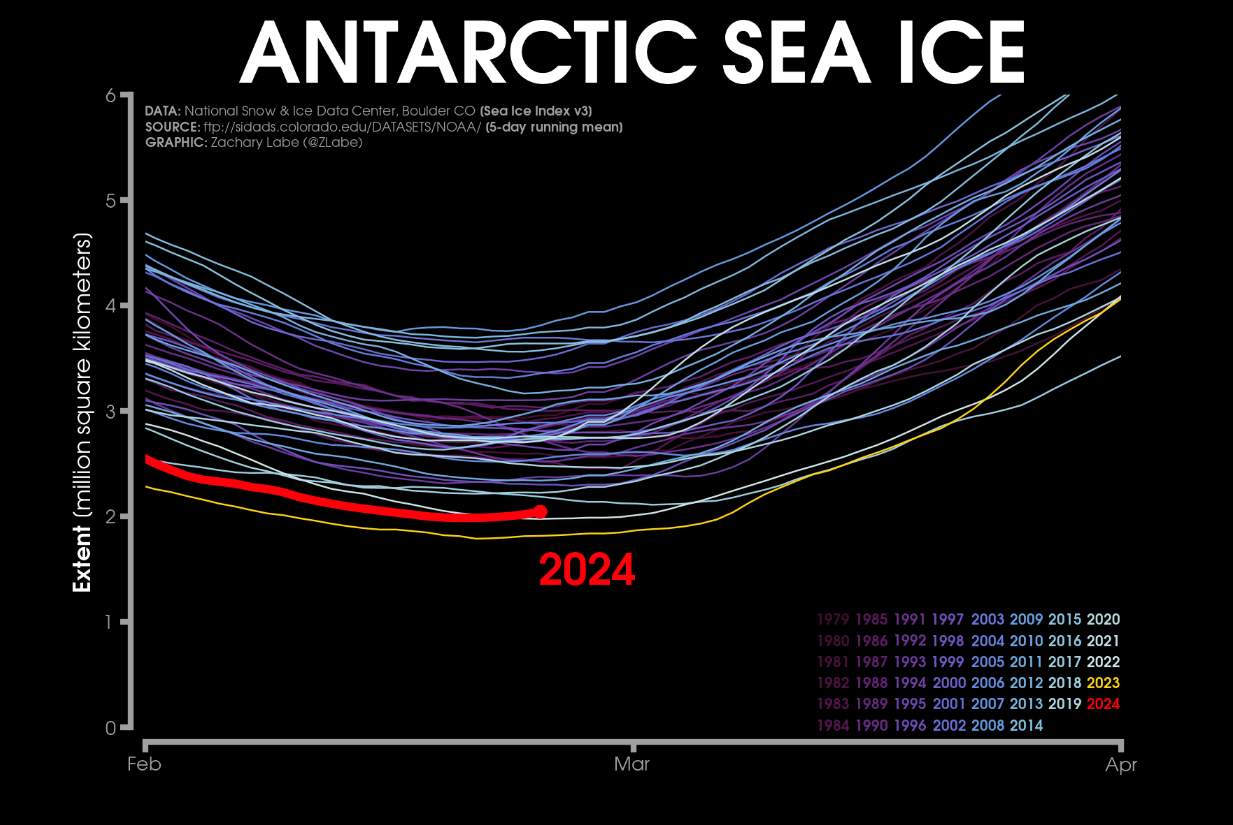
Fig. 2: Sea ice extent in the Antarctic compared with the years since 1979; Source: Zack Labe
Not only is the ice area very small, but the ice thickness is also very low in most areas. The negative deviation in West Antarctica is particularly large in the Bellinghausen Sea, the Amundsen Sea and the Ross Sea. In contrast, the ice in the Wedell Sea is thicker than usual!
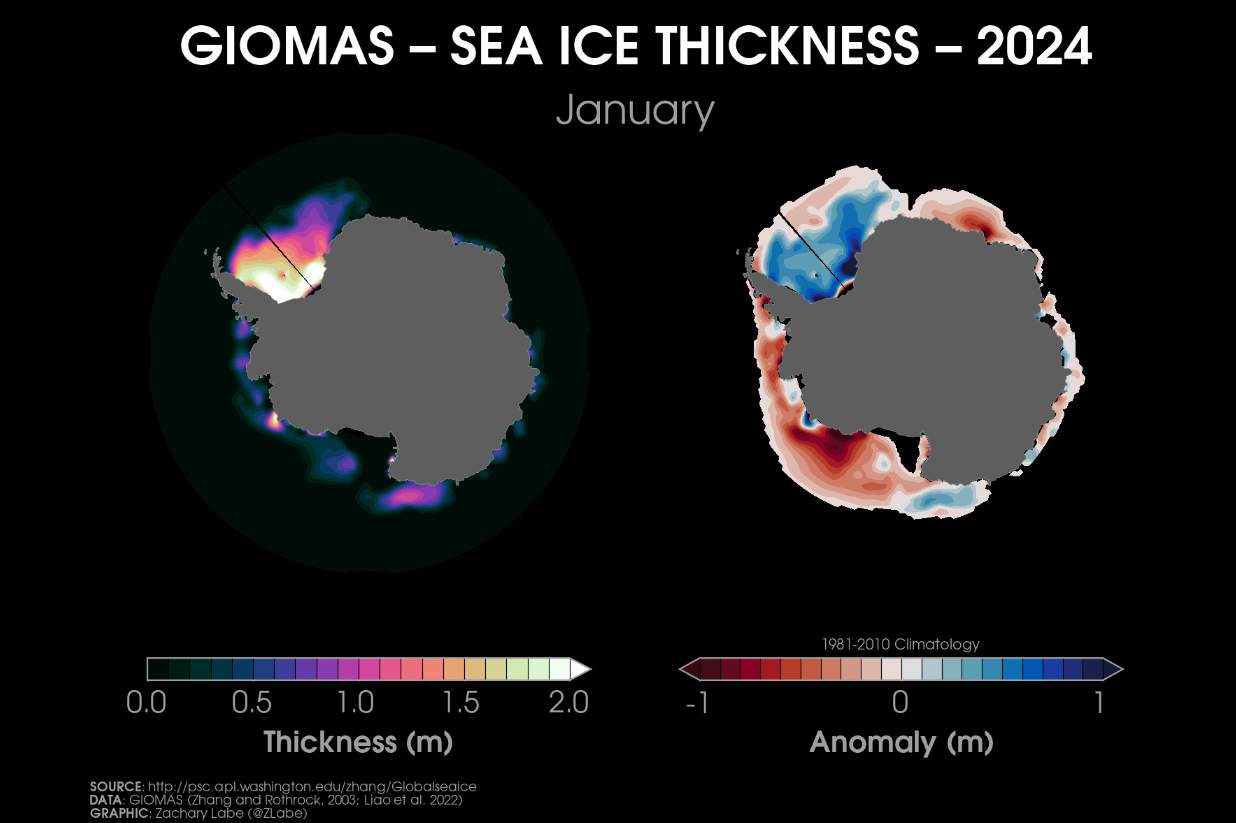
Fig. 3: Ice thickness and its deviation from the long-term norm; Source: Zack Labe
More ice cover in the Arctic
The picture in the Arctic is somewhat different. In a long-term comparison, the ice cover has been low since 1979, but not to the same extent as before. Compared to the average for the years 2010 to 2019, there is now more ice. The area is still increasing slightly, but the annual maximum will be reached within the next 1 to 4 weeks.
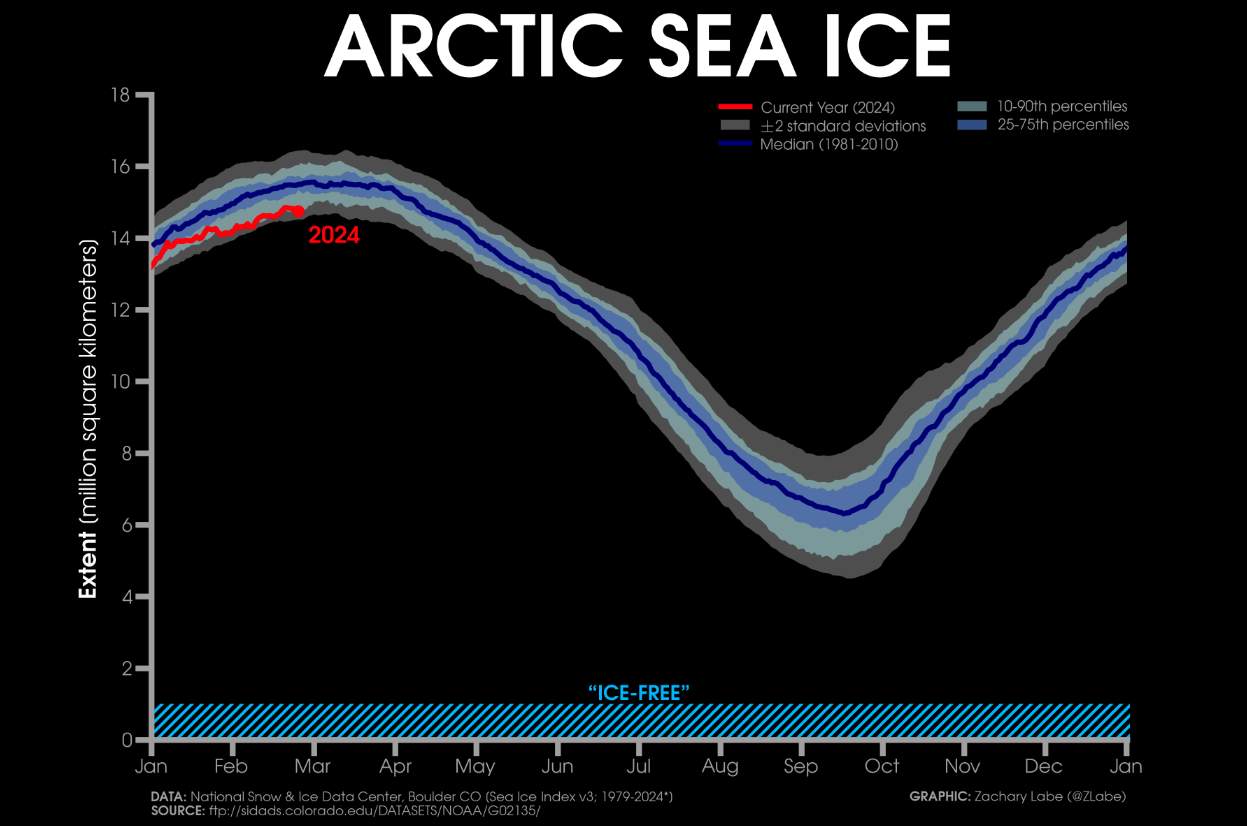
Fig. 4: Sea ice cover in the Arctic compared to the years since 1979; Source: Zack Labe
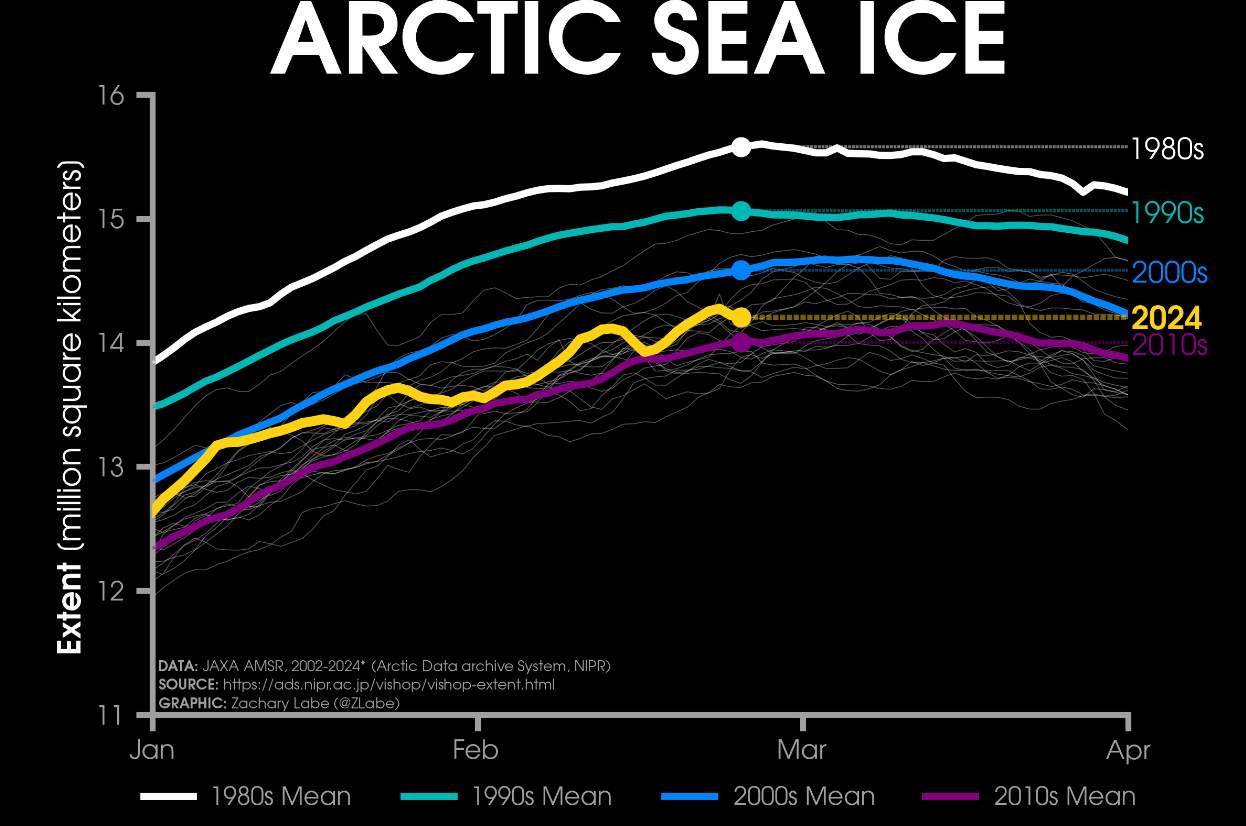
Fig. 5: Sea ice cover in the Arctic compared to the mean values of recent decades; Source: Zack Labe
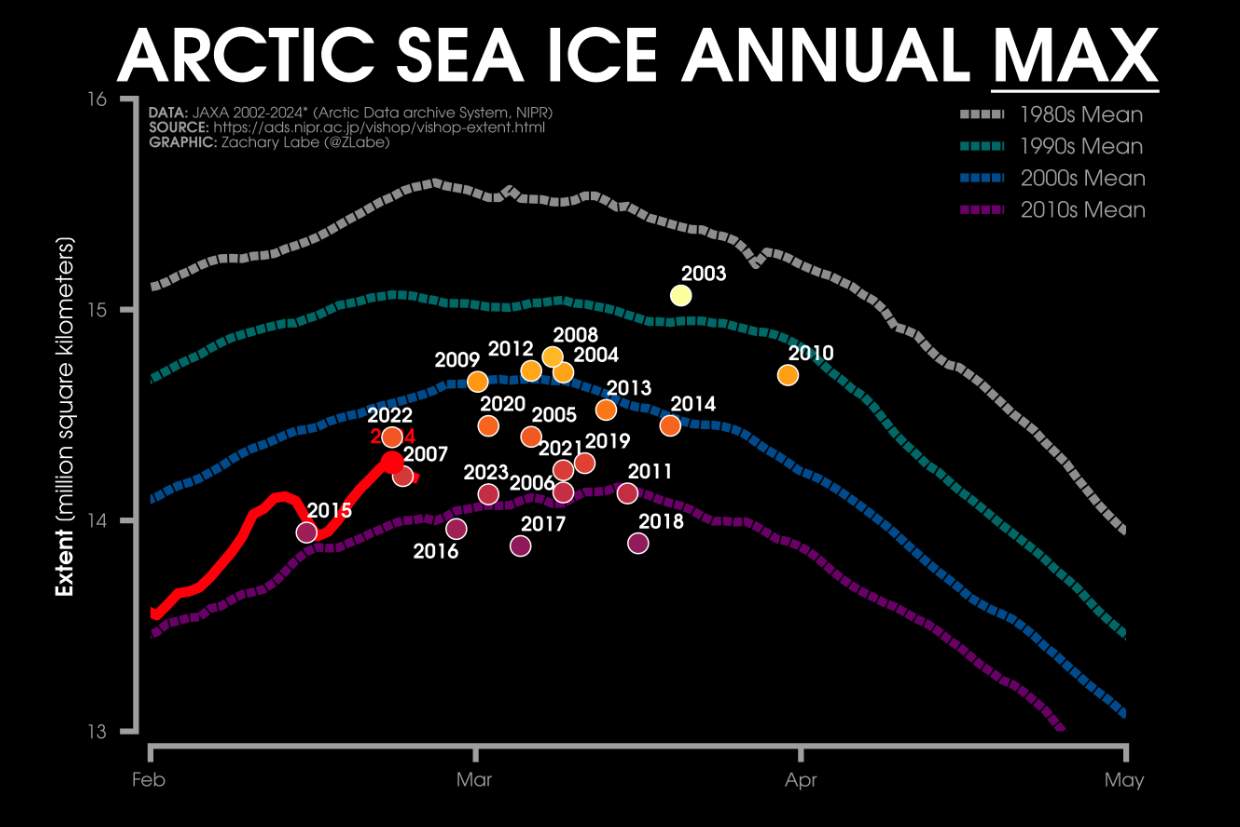
Fig. 6: Current Arctic ice cover compared to the maxima of previous years; Source: Zack Labe
Although the area of ice is slightly larger again, the thickness and volume are not! The ice is getting thinner, but can form and expand somewhat faster as a result.
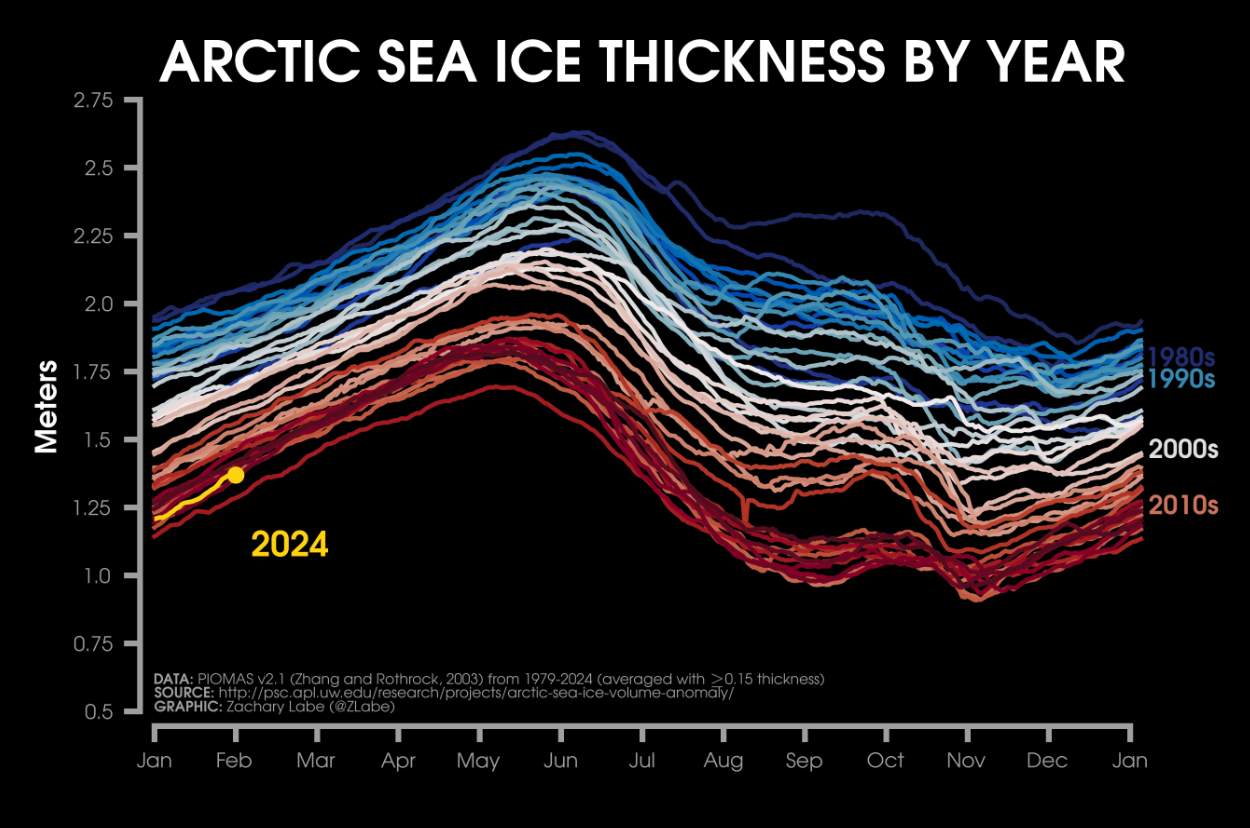
Fig. 7: Sea ice thickness in the Arctic compared to recent years; Source: Zack Labe
Summer balance of Arctic sea ice
The minimum sea ice extent in the Arctic on September 15 was about 4.33 million km², ranking 7th lowest since detailed data collection began in 1979. Even smaller sea ice areas were all measured after 2007 (record year 2012 with 3.27 million km²). Compared to previous years, ice melt in the East Arctic was relatively slow. Experts explain this with the often prevailing low-pressure systems over the Russian part of the Arctic, which caused an above-average ice drift from the Arctic central regions to the East Arctic. This explanation is also supported by the fact that the sea ice in this region has a comparatively higher ice thickness.
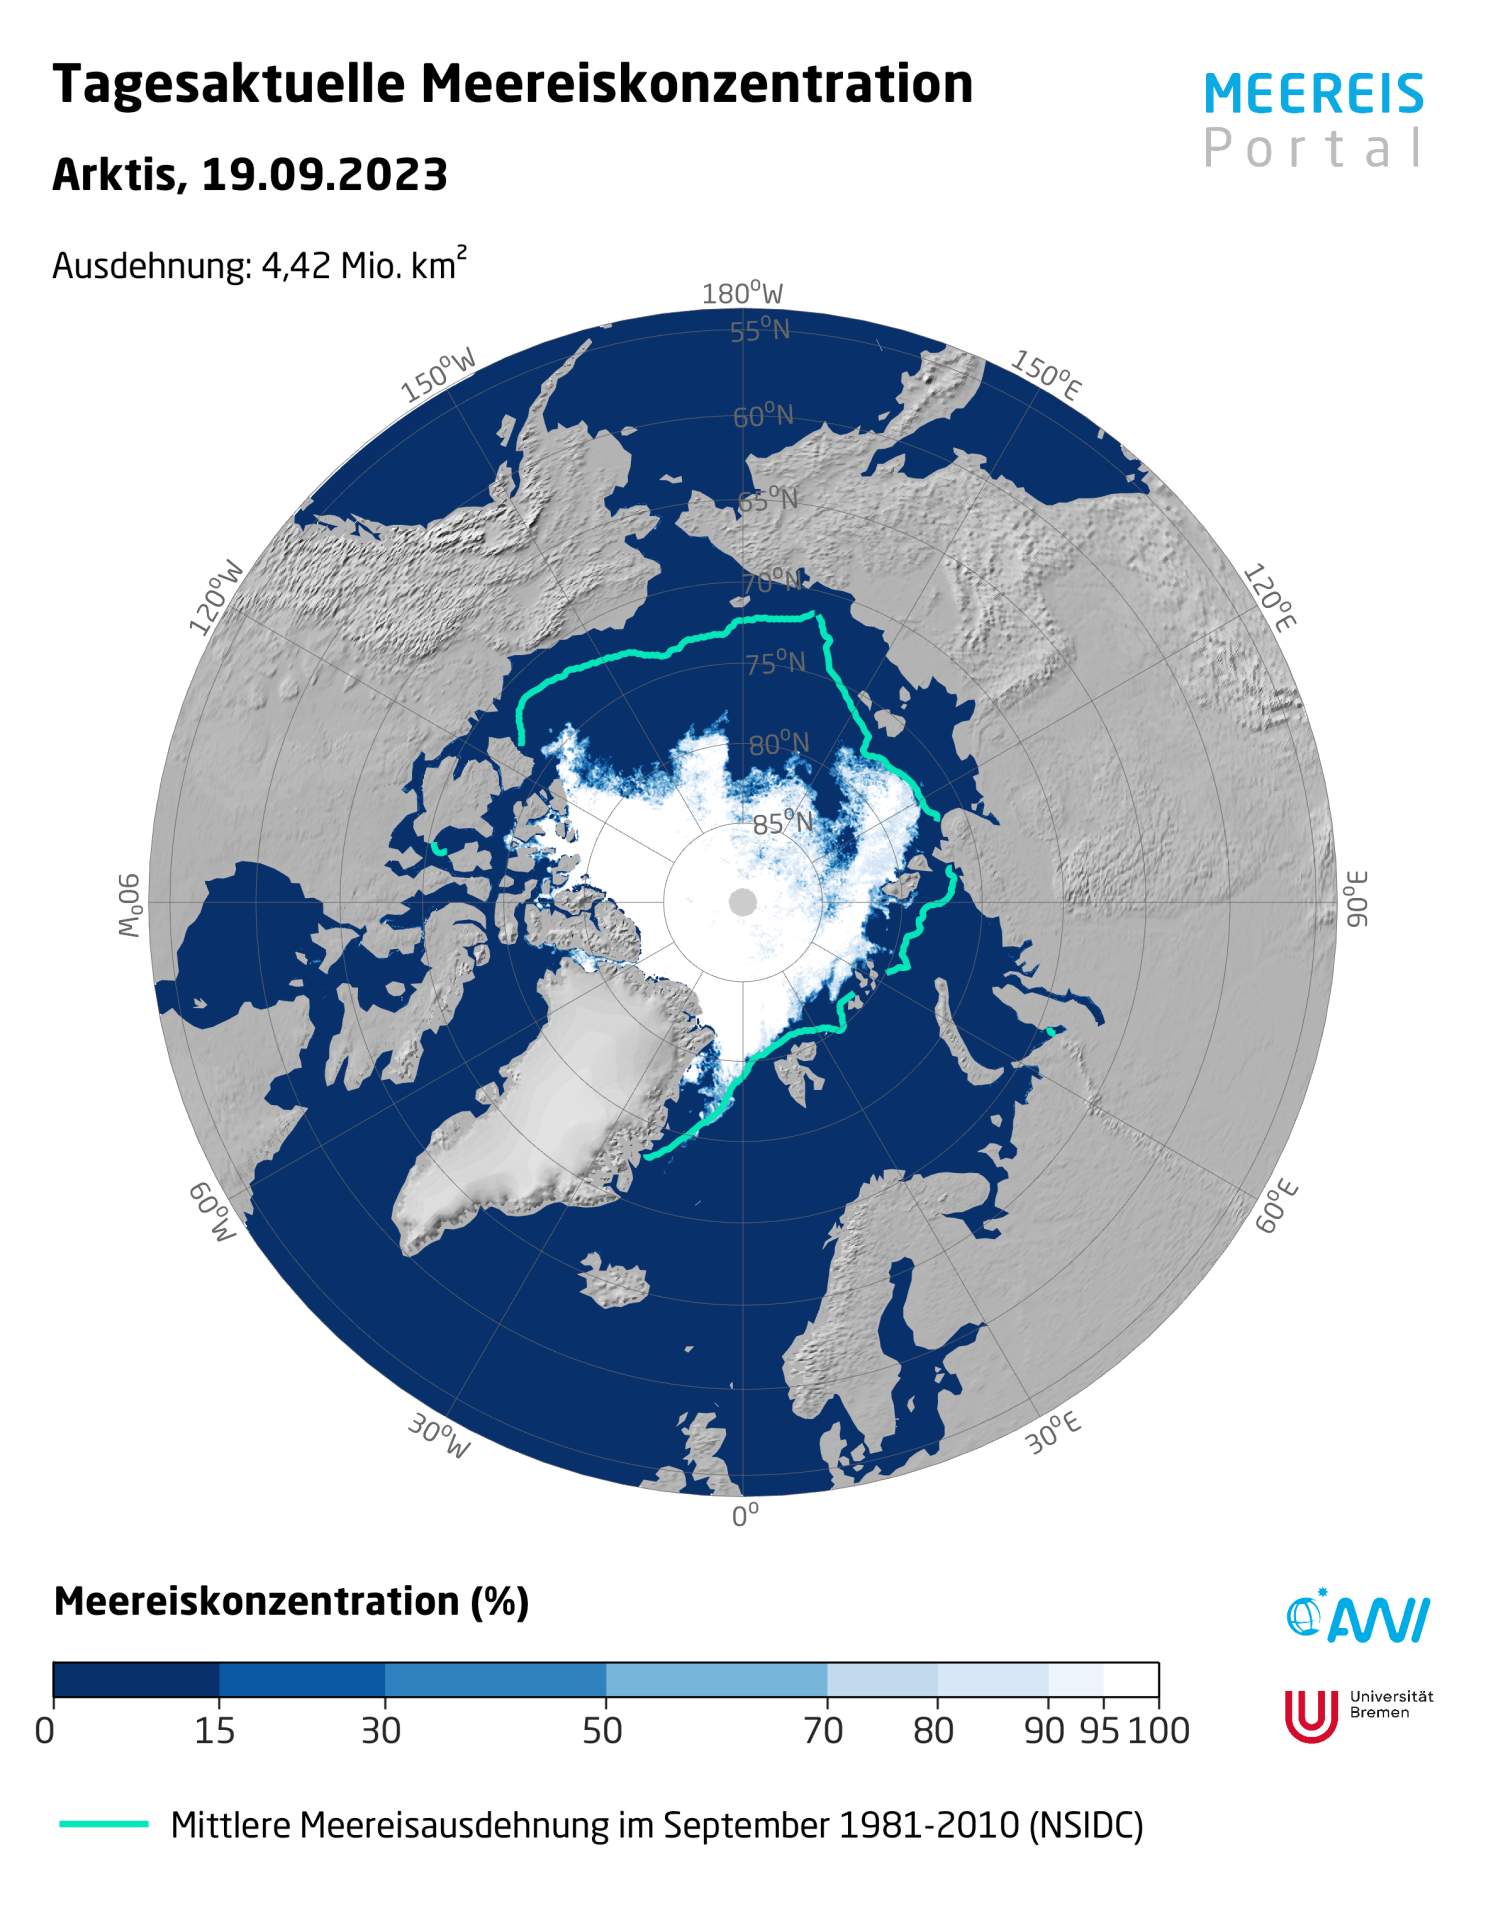
Fig. 1: Sea ice concentration in the Arctic compared to normal; Source: Meereisportal
Never before so little sea ice in the Antarctic winter
In February of this year, the lowest sea ice extent ever recorded in Antarctica was recorded at about 2 million km²(see also this blog). In the following austral autumn and winter, this deficit was never made up. Even more, the deviation from the norm or the previous negative record became larger and larger in recent months, with new records being set every month since May. At the peak of sea ice extent in early September, a maximum ice area of 17.16 million km² was recorded. The previous record minimum was undercut by 880,000 km² – more than the combined area of Spain and Germany. The deficit of sea ice cover is particularly large in the Weddell Sea, the Cosmonaut Sea and the Ross Sea.
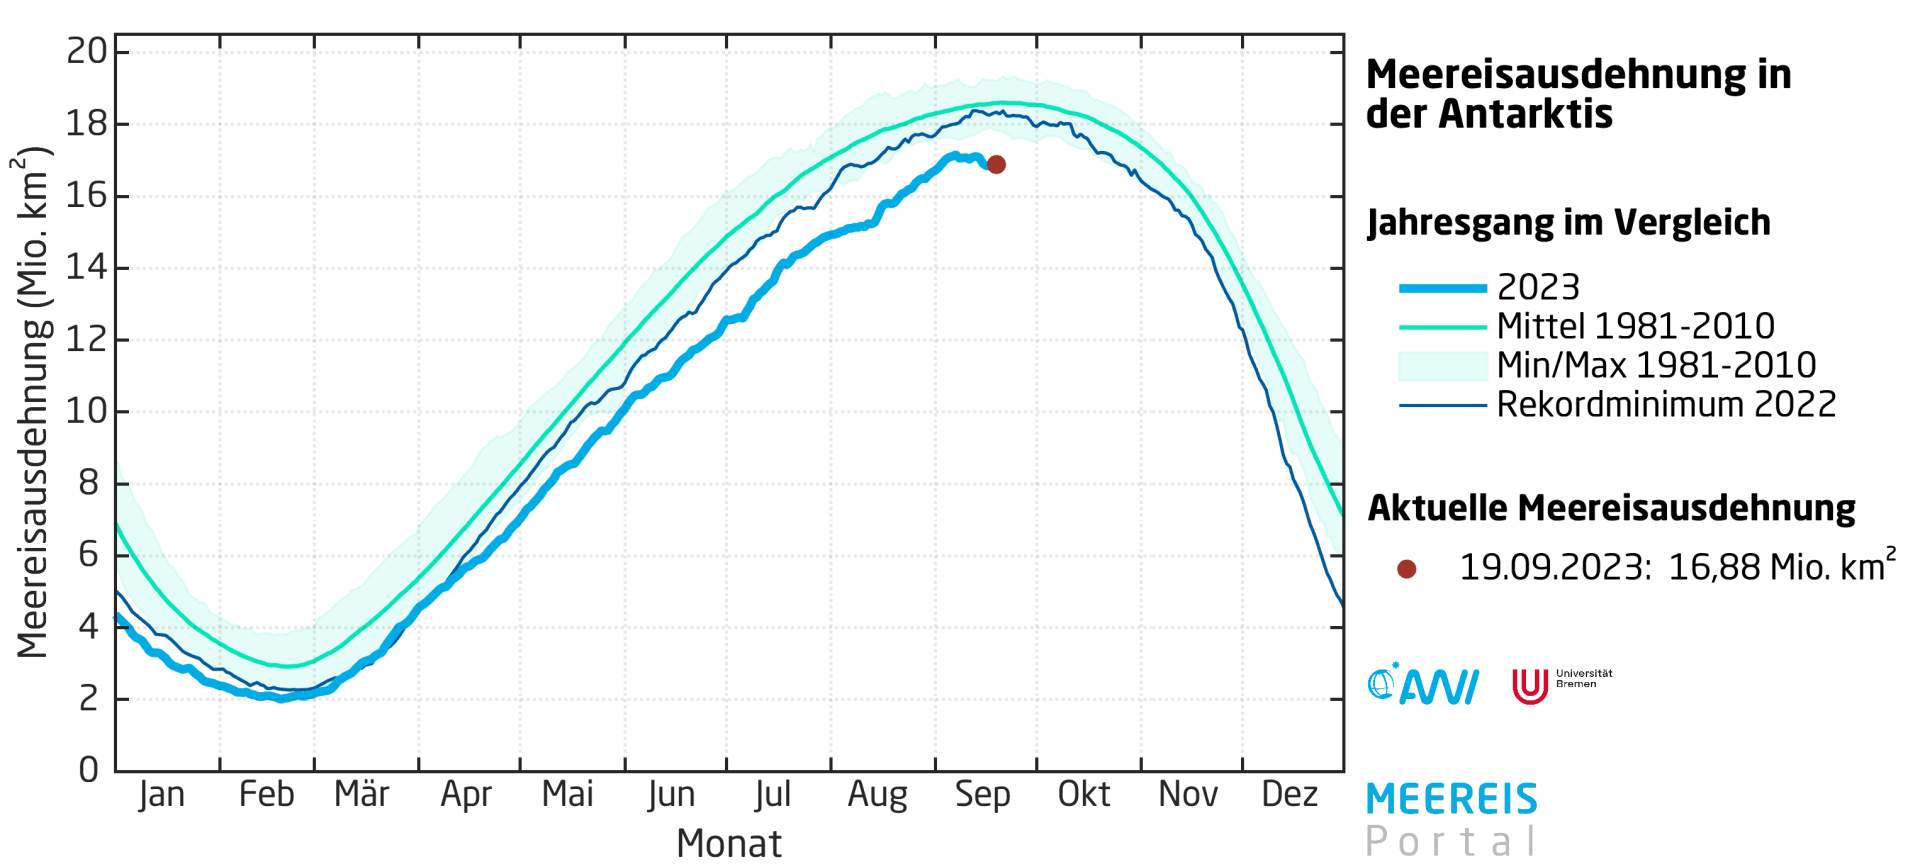
Fig. 2: Ongoing sea ice extent in Antarctica ; Source: Meereisportal
Even more impressive than the absolute figures are the anomalies, i.e. the difference to the average values. The period 1981 to 2010 is often used as the average in this context. Even if the negative deviation has weakened somewhat in recent weeks, the following graph illustrates the current year as an extreme downward outlier.
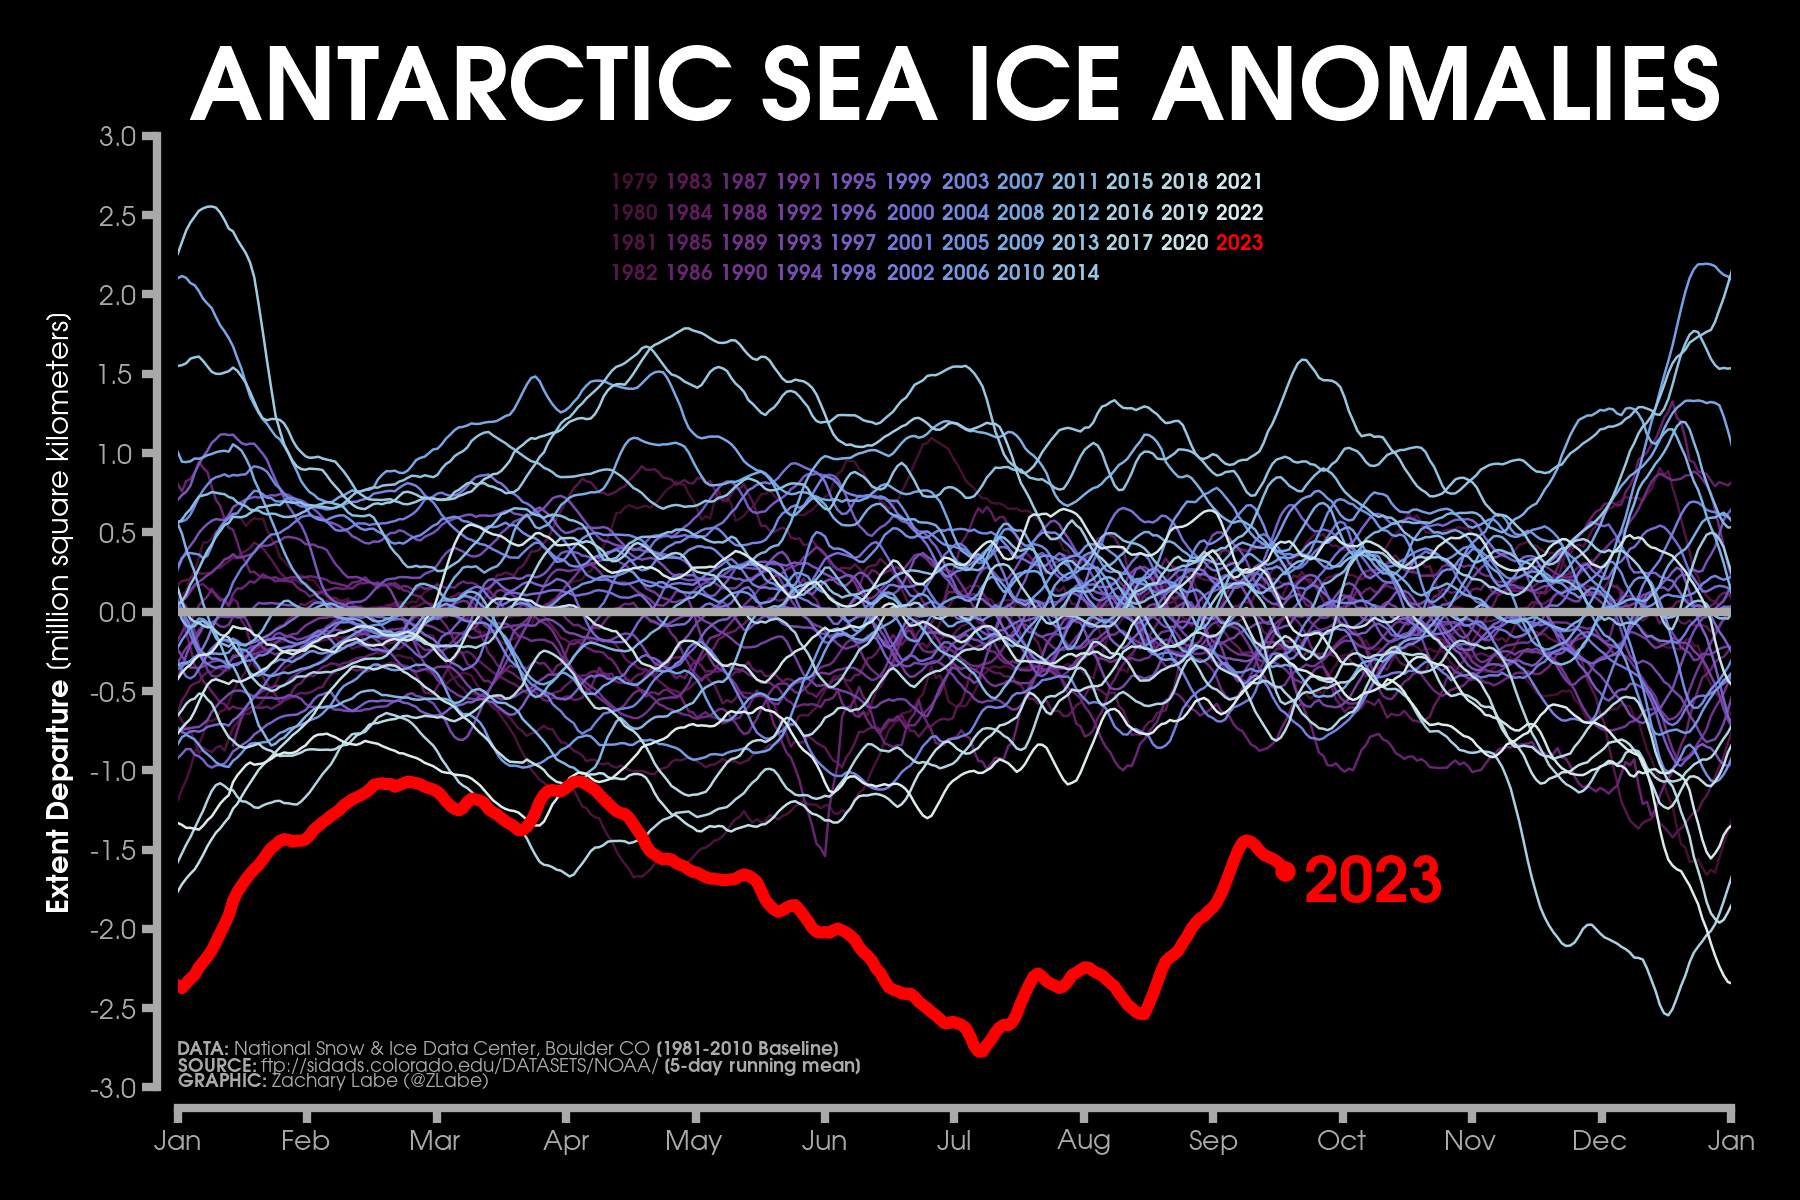
Fig. 3: Deviation of sea ice extent in Antarctica compared to the 1981-2010 average.; Source: Zach Labe
Global sea ice extent
In terms of combined sea ice extent, we typically reach the greatest extent in mid-November. This is because the sea ice area in the Arctic initially increases even faster than it melts in the Antarctic. From mid-November, the actual melting season begins in the southern hemisphere. Since Antarctica has significantly larger ice areas than its northern counterpart, the ice area gain in the northern hemisphere can no longer compensate for the decrease in the south. However, the snapshot does not promise much positivity in this regard either. Currently, the combined sea ice areas reach about 21.3 million km², which is about 4 million km² less than the long-term average (about twice the area of Greenland).
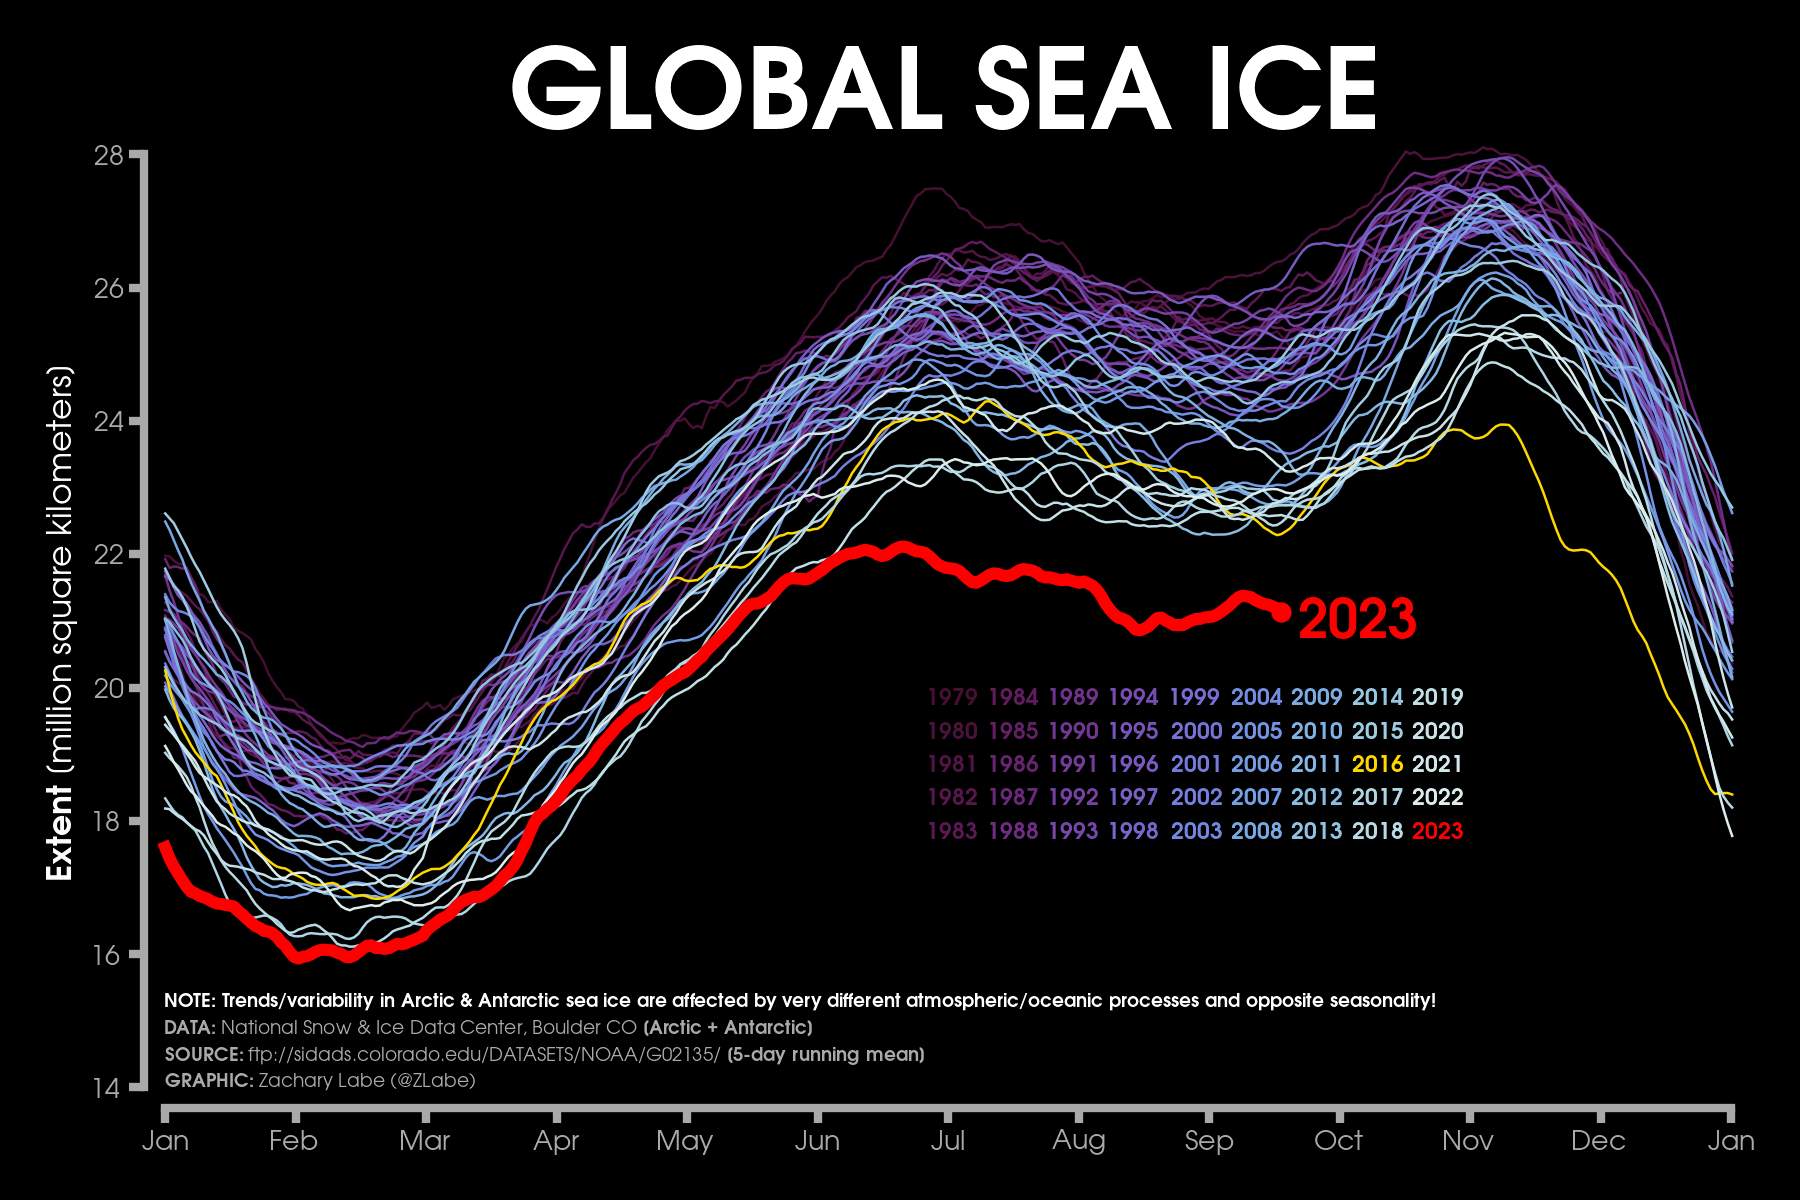
Fig. 4: Global sea ice extent compared with previous years; Source: Zach Labe
Based on the current trend, this deficit is not expected to decrease rapidly. We will probably hear about new records soon.
disclaimer
The content of this article has been at least partially computer translated from another language. Therefore, grammatical errors or inaccuracies are possible. Please note that the original language version of the article should be considered authoritative.

